Oddsworth

Sydney Thunder v Adelaide Strikers: Strikers 56% to win

Thunder 44%. Strikers 56%.

KFC BBL|16, match 3Wednesday 16 December 2026, 7:15pm AEDTManuka Oval, Canberra

Thunder

ParBatting+5.2Bowling−1.2Overall+4.0

Strikers

ParBatting+7.0Bowling+3.1Overall+10.2

Thunder bat first

First innings170
Strikers chase in17.5 overs
59%Strikers win
41%Thunder win

Strikers bat first

First innings172
Thunder short by29 runs
53%Strikers win
47%Thunder win

First innings

170Thunder bat first
172Strikers bat first
174Par
163Recent average here

Par is the total defended about half the time. The recent average covers 6 innings since Sept 2023.

Chasing here

50%

3 of 6 won chasing over the last three years. All-time 63% (17 of 27). BBL and T20Is.

Rain risk

4%

of games in dry weather at Australian BBL grounds were shortened (26 of 636).

The match is beyond the forecast range, so pick a past evening at the ground. The win chance and players stay the same.

Strengths and weaknesses

Matt ShortBatting standout, Strikers: 452 runs, SR 145 (last 10)
Hassan AliBowling standout, Strikers: 24 wkts, econ 8.03 (last 10)
ThunderBowling weakness: −1.2 runs a game. McAndrew econ 10.63 in the last 10.

Adelaide Strikers favoured by about 6 runs on paper

Adelaide Strikers are favoured, with a 56% win chance and a paper strength about 6 runs clear of Sydney Thunder. The edge is mostly from bowling: Adelaide are rated 4.3 runs better with the ball and 1.9 runs better with the bat. Thunder's batting is solid at 5.2 runs above average, but their bowling is 1.2 runs worse than average, leaving them with a total of 4 runs against Adelaide's 10.2.

Both sides project to score in the low 170s, with Adelaide slightly ahead at 172 to Thunder's 170. The par score here is 174, and the recent league first-innings average is 170 from 60 innings. At this ground, the recent average is 163 from six innings since September 2023, and the all-time median is also 163 from 31 innings. Chasing has been the sharper angle: 17 of 27 all-time games here have been won by the side batting second, and the last six have split 3-3.

The case for the Thunder

  • Batting unit rated 5.2 runs better than average, with David Warner 4 runs better than an average batter and Sam Billings 1.9 runs better.
  • Daniel Sams and Chris Green provide dual threat: Sams is rated 0.9 runs better with the bat and 1.1 runs better with the ball; Green is 1.7 and 2.2 runs better respectively.

Batting standout

David Warner

515 runs, SR 149, 15 sixes in the last 10. Rated +4.0 runs a game with the bat.

Rated 4 runs better than an average batter. He has 515 runs at a strike rate of 149.3 in his last 10 T20 matches, including 15 sixes, and is Thunder's leading batting threat.

Bowling standout

Chris Green

6 wkts, econ 7.72 in the last 10. Rated +2.2 runs a game with the ball.

Rated 2.2 runs better than an average bowler and 1.7 runs better with the bat. In his last 10 T20 matches he has 6 wickets at an economy of 7.72 and 142 runs at a strike rate of 149.5.

Bowling weaknesses

Nathan McAndrew

15 wkts, econ 10.63 in the last 10. Rated −1.8 runs a game with the ball.

Rated 1.8 runs worse than an average bowler over four overs. He has 15 wickets but an economy of 10.63 in his last 10 T20 matches, and his selection is among the least certain.

Ryan Hadley

2 wkts, econ 12.79 in the last 4. Rated −3.6 runs a game with the ball.

Rated 3.6 runs worse than an average bowler over three overs, on limited data. He has 2 wickets at an economy of 12.79 in his last four T20 matches, a small sample.

The case for the Strikers

  • Rated 4.3 runs better than Thunder with the ball, led by Hassan Ali (3.2 runs better than average) and Chris Green's opposite number, with Cameron Boyce also 1.8 runs better.
  • Batting edge of 1.9 runs, with Matt Short rated 4.2 runs better than an average opener and Mark Chapman 3 runs better than an average middle-order batter.

Batting standout

Matt Short

452 runs, SR 145, 19 sixes in the last 10. Rated +4.2 runs a game with the bat.

Rated 4.2 runs better than an average opener. He has 452 runs at a strike rate of 144.9 in his last 10 T20 matches, with 19 sixes, and also offers 14 wickets at an economy of 7.6 in that window.

Bowling standout

Hassan Ali

24 wkts, econ 8.03 in the last 10. Rated +3.2 runs a game with the ball.

Rated 3.2 runs better than an average bowler over four overs. He has 24 wickets at an economy of 8.03 in his last 10 T20 matches, a strong recent return.

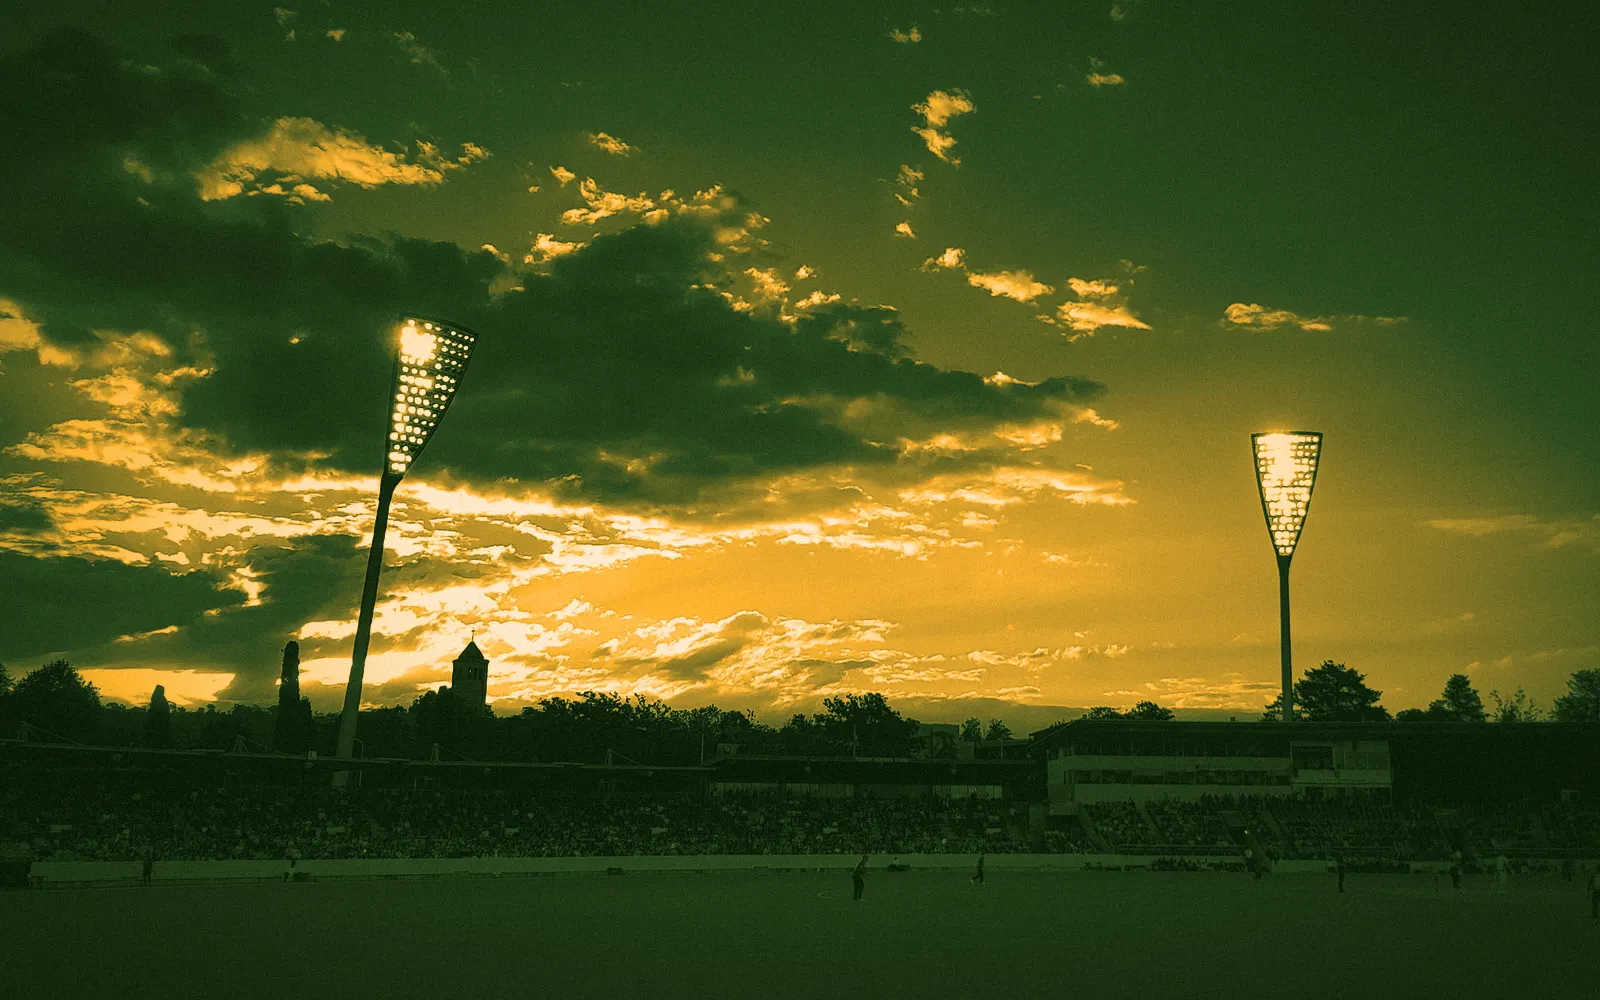
Photo: Steve · CC BY-SA 2.0

Manuka Oval

Canberra, Australia · 29 BBL matches here

Manuka Oval was enclosed as a sports ground in 1929 and has staged the Prime Minister's XI match since 1951.

Opened
1929
Capacity
15,000 seats
Ends
Pool End · Manuka End
Home to
Sydney Thunder (BBL), second home

The ground's full record

Every first innings here

8 of 31

reached par (174). Median 163.

Under par Par or more

Recent BBL first innings average 170; games here have scored in line with their leagues' averages. Medians by era: 2008–2017 147, 2018–2022 166, 2023 onward 151.

What total is safe?

First inningsDefended
Under 1500%0 of 9
150–16938%3 of 8
170–18950%3 of 6
190–209100%3 of 3
210+100%1 of 1

Weather: dry, like 3 Dec 2020

3 December 2020 at Manuka Oval: 19 °C, humidity 52%, wind 12 km/h and 0 mm of rain during the hours of play. 38 of 430 evenings within three weeks of 16 December in the last 10 years had at least 1 mm of rain at Manuka Oval during these hours.

These conditions are dry, with no rain expected during play. Similar dry evenings at Australian BBL grounds have seen only 4% of games shortened or washed out, so rain should not be a factor. The match starts at 7:15pm AEDT, and any rain would overlap the first innings, but none is forecast. Heat and wind have made no measurable difference to first-innings scoring at Australian BBL grounds.

During play: 19.3 °C on average, humidity 52%, wind 12 km/h gusting to 37. Humidity climbs from 39% to 64%; at Australian BBL grounds, chasing success hasn't varied with humidity.

Sydney Thunder XI

Batting positionPlayer and last 10BatBowl
1Matt Gilkes232 runs, SR 156−0.3–
2Sam Konstas160 runs, SR 106−2.4–
3David Warner515 runs, SR 149+4.0–
4Cameron Bancroft180 runs, SR 111−1.3–
5Sam Billingskeeper273 runs, SR 155+1.9–
6Daniel Sams4 overs50 runs, SR 106; 15 wkts, econ 7.38+0.9+1.1
7Chris Green3 overs142 runs, SR 150; 6 wkts, econ 7.72+1.7+2.2
8Nathan McAndrewunsigned, 4 overs15 wkts, econ 10.63–−1.8
9Tanveer Sangha4 overs5 wkts, econ 8.61–+2.0
10Ryan Hadley3 overs2 wkts, econ 12.79–−3.6
11Aidan O'Connor2 overs1 wkts, econ 8.50–−1.1

Team record and squad

Adelaide Strikers XI

Batting positionPlayer and last 10BatBowl
1Matt Short2 overs452 runs, SR 145; 14 wkts, econ 7.60+4.2+0.3
2Alex Careykeeper219 runs, SR 153+0.9–
3Liam Scott232 runs, SR 123+1.6–
4Jason Sangha187 runs, SR 121−0.9–
5Mark Chapman289 runs, SR 149+3.0–
6Ben Stokes2 overs156 runs, SR 108; 5 wkts, econ 7.96 (form 41 months old)−0.1−0.9
7Jerrssis Wadia52 runs, SR 137−0.8–
8Henry Thornton4 overs12 wkts, econ 8.68–−0.3
9Hassan Aliunsigned, 4 overs24 wkts, econ 8.03–+3.2
10Lloyd Pope4 overs14 wkts, econ 7.89–−1.0
11Cameron Boyceunsigned, 4 overs8 wkts, econ 8.85–+1.8

Team record and squad

Share