Tim David
265 runs, SR 160, 21 sixes in the last 10. Rated +5.8 runs a game with the bat.
Rated 5.8 runs better than an average batter. He has 265 runs at a strike rate of 159.6 in his last 10 T20 matches, including 21 sixes.

Hurricanes 56%. Heat 44%.
KFC BBL|16, match 4Thursday 17 December 2026, 7:15pm AEDTBellerive Oval, Hobart
Par is the total defended about half the time. The recent average covers 18 innings since Sept 2023.
12 of 18 won chasing over the last three years. All-time 48% (39 of 81). BBL and T20Is.
of games in dry weather at Australian BBL grounds were shortened (26 of 636).
The match is beyond the forecast range, so pick a past evening at the ground. The win chance and players stay the same.
of games in wet weather at Australian BBL grounds were shortened or washed out (37 of 101).
The match is beyond the forecast range, so pick a past evening at the ground. The win chance and players stay the same.
of games in dry weather at Australian BBL grounds were shortened (26 of 636).
The match is beyond the forecast range, so pick a past evening at the ground. The win chance and players stay the same.
Hobart Hurricanes are favoured, with a 56% win chance, and they are also the stronger side on paper by about 18 runs. That edge comes from both batting and bowling: they are 7.2 runs better with the bat and 10.7 runs better with the ball. Their team strength is 26.2 runs above average, against Brisbane Heat's 8.4.
The runs picture points to a par score of 174, with Hobart projected at 179 batting first and Brisbane at 167. Chasing has been the way here: 12 of the last 18 games at this ground were won by the side batting second. The sharpest angle is Brisbane's bowling, rated 1.1 runs worse than average, against a Hobart batting line-up with several positive contributors.
265 runs, SR 160, 21 sixes in the last 10. Rated +5.8 runs a game with the bat.
Rated 5.8 runs better than an average batter. He has 265 runs at a strike rate of 159.6 in his last 10 T20 matches, including 21 sixes.
13 wkts, econ 7.24 in the last 10. Rated +4.4 runs a game with the ball.
Rated 4.4 runs better than an average bowler over four overs. He has 13 wickets at an economy of 7.24 in his last 10 T20 matches.
11 wkts, econ 7.38 in the last 10. Rated +3.8 runs a game with the ball.
Rated 3.8 runs better than an average bowler over four overs. He has 11 wickets at an economy of 7.38 in his last 10 T20 matches.
270 runs, SR 126, 9 sixes in the last 10. Rated +3.3 runs a game with the bat.
Rated 3.3 runs better than an average batter. He has 270 runs at a strike rate of 126.2 in his last 10 T20 matches.
13 wkts, econ 9.85 in the last 10. Rated −1.0 runs a game with the ball.
Rated 1 run worse than an average bowler over four overs. He has 13 wickets at an economy of 9.85 in his last 10 T20 matches.
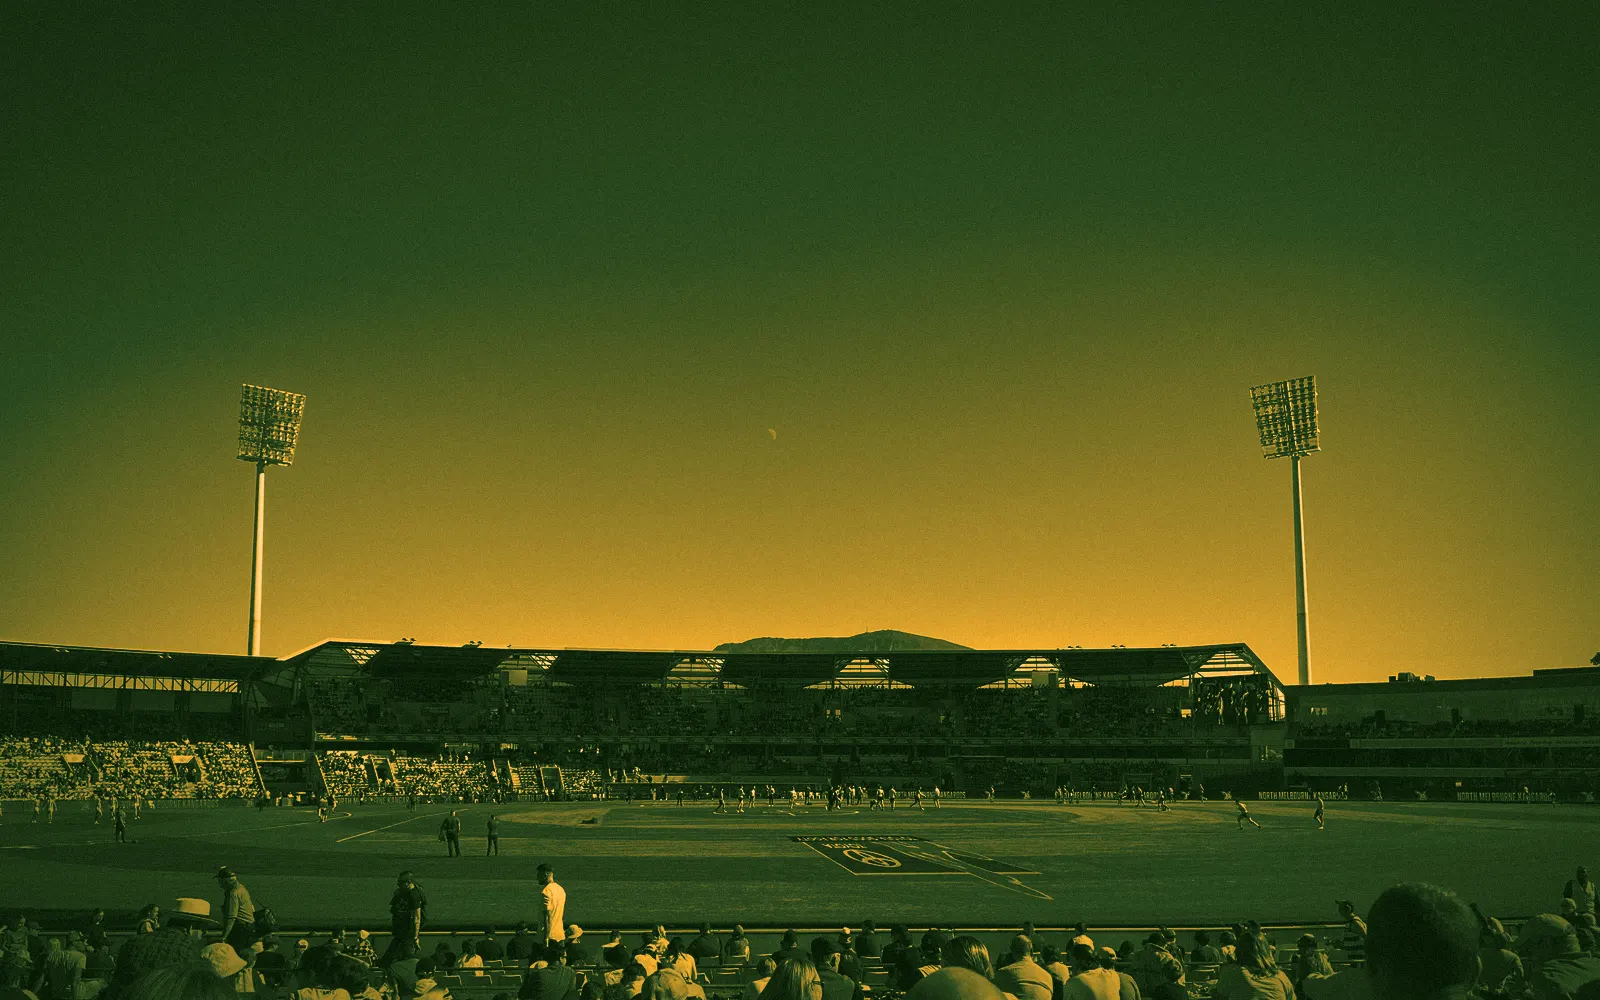
Hobart, Australia · 71 BBL matches here
The ground on the Derwent dates from 1914 and was rebuilt in the mid-1980s to take first-class and international cricket, hosting its first Test in December 1989.
reached par (174). Median 167.
Recent BBL first innings average 170; games here have scored in line with their leagues' averages. Medians by era: 2008–2017 166, 2018–2022 167, 2023 onward 170.
2 December 2023 at Bellerive Oval: 15 °C, humidity 81%, wind 9 km/h and 0 mm of rain during the hours of play. 40 of 430 evenings within three weeks of 17 December in the last 10 years had at least 1 mm of rain at Bellerive Oval during these hours.
These conditions are dry, like 2 December 2023 at Bellerive Oval, with 0 mm of rain during the hours of play. Rain risk is low. Across 636 games at Australian BBL grounds in similar weather, 4% were shortened or washed out. Rain should not be a factor, and heat and wind have made no measurable difference to first-innings scoring at Australian BBL grounds.
During play: 15.2 °C on average, humidity 81%, wind 9 km/h gusting to 34.
30 December 2025 at Bellerive Oval: 14 °C, humidity 84%, wind 7 km/h and 2.4 mm of rain during the hours of play. 40 of 430 evenings within three weeks of 17 December in the last 10 years had at least 1 mm of rain at Bellerive Oval during these hours.
This weather is wet, like 30 December 2025 at Bellerive Oval, with 2.4 mm of rain during the hours of play. At Australian BBL grounds, 37% of games in similar weather were shortened or washed out. The wettest spell is 19:00 to 20:00, overlapping the first innings. Lost overs and a rain-rule finish are a real possibility. Heat and wind have made no measurable difference to scoring.
During play: 13.5 °C on average, humidity 84%, wind 7 km/h gusting to 28.
Heaviest rain 19:00–20:00, mostly over the first innings. Runs figures assume 20 overs. If overs are lost, totals and par come down: check how your bookmaker settles runs markets in reduced matches.
26 November 2017 at Bellerive Oval: 19 °C, humidity 86%, wind 6 km/h and 0 mm of rain during the hours of play. 40 of 430 evenings within three weeks of 17 December in the last 10 years had at least 1 mm of rain at Bellerive Oval during these hours.
These conditions are dry, with no rain expected during play. Similar weather at Australian BBL grounds has seen only 4% of games shortened or washed out. Rain should not be a factor, and it will not overlap either innings. Heat and wind have made no measurable difference to first-innings scoring at Australian BBL grounds.
During play: 19.3 °C on average, humidity 86%, wind 6 km/h gusting to 30. Humidity climbs from 80% to 92%; at Australian BBL grounds, chasing success hasn't varied with humidity.
| Batting position | Player and last 10 | Bat | Bowl |
|---|---|---|---|
| 1 | Mitch Owen206 runs, SR 178 | +5.7 | – |
| 2 | Beau Webster531 runs, SR 152 | +2.3 | – |
| 3 | Ben McDermottkeeper226 runs, SR 139 | +2.1 | – |
| 4 | Nikhil Chaudhary138 runs, SR 115 | +2.3 | – |
| 5 | Tim David265 runs, SR 160 | +5.8 | – |
| 6 | Chris Jordanunsigned, 1 over82 runs, SR 121; 9 wkts, econ 7.90 | +0.7 | +0.4 |
| 7 | Nathan Ellis4 overs13 wkts, econ 7.24 | +0.2 | +4.4 |
| 8 | Adam Zampa4 overs11 wkts, econ 7.38 | – | +3.8 |
| 9 | Rishad Hossainunsigned, 4 overs10 wkts, econ 9.64 | – | +0.2 |
| 10 | Riley Meredith4 overs17 wkts, econ 8.77 | – | +1.9 |
| 11 | Billy Stanlake3 overs10 wkts, econ 8.30 | – | −1.2 |
| Batting position | Player and last 10 | Bat | Bowl |
|---|---|---|---|
| 1 | Jack Wildermuth3 overs222 runs, SR 159; 10 wkts, econ 9.92 | +0.5 | −2.0 |
| 2 | Nathan McSweeney210 runs, SR 146 | +0.1 | – |
| 3 | Tim Robinson178 runs, SR 131 | +0.7 | – |
| 4 | Matthew Renshaw2 overs270 runs, SR 126; 3 wkts, econ 7.00 | +3.3 | +0.1 |
| 5 | Max Bryant222 runs, SR 152 | +2.2 | – |
| 6 | Tom Curran3 overs12 wkts, econ 7.71 | +1.5 | +0.2 |
| 7 | Hugh Weibgen151 runs, SR 107 | −0.3 | – |
| 8 | Jimmy Peirsonkeeper, unsigned145 runs, SR 131 | +0.4 | – |
| 9 | Xavier Bartlett4 overs11 wkts, econ 7.82 | – | +0.7 |
| 10 | Michael Neser4 overs13 wkts, econ 9.85 | – | −1.0 |
| 11 | Matt Kuhnemann4 overs9 wkts, econ 7.29 | – | +0.8 |
.jpg)