Finn Allen
171 runs, SR 154, 11 sixes in the last 10. Rated +6.7 runs a game with the bat.
Rated 6.7 runs better than an average batter. He has 171 runs at a strike rate of 154 in his last 10 T20 matches, with 11 sixes.

Stars 54%. Heat 46%.
KFC BBL|16, match 8Monday 21 December 2026, 7:15pm AEDTJunction Oval, Melbourne
Par is the total defended about half the time. No completed first innings here since Sept 2023.
0 of 2 won chasing all-time. No completed game here in the last three years. BBL only.
of games in dry weather at Australian BBL grounds were shortened (26 of 636).
The match is beyond the forecast range, so pick a past evening at the ground. The win chance and players stay the same.
of games in wet weather at Australian BBL grounds were shortened or washed out (37 of 101).
The match is beyond the forecast range, so pick a past evening at the ground. The win chance and players stay the same.
of games in dry weather at Australian BBL grounds were shortened (26 of 636).
The match is beyond the forecast range, so pick a past evening at the ground. The win chance and players stay the same.
Melbourne Stars are favoured, with a win chance of 54% to Brisbane Heat's 46%. The edge is about 12 runs on paper, built from both batting and bowling: Stars are 6 runs better with the bat and 5.7 runs better with the ball. Their team strength is 20 runs above average, against Heat's 8.4.
Stars project 183 batting first, Heat 174, against a par score of 178. The recent league first-innings average is 170 from 60 innings. At this ground there have been only two men's T20 games, both in the BBL, and both were won by the side batting first. The sharpest angle is the gap in projected first-innings runs: Stars are 9 runs clear of Heat, and the par score sits between them.
171 runs, SR 154, 11 sixes in the last 10. Rated +6.7 runs a game with the bat.
Rated 6.7 runs better than an average batter. He has 171 runs at a strike rate of 154 in his last 10 T20 matches, with 11 sixes.
204 runs, SR 138, 11 sixes in the last 10. Rated +2.8 runs a game with the bat.
Rated 2.8 runs better than an average batter and 0.5 runs better than an average bowler. He has 204 runs at a strike rate of 137.8 and 16 wickets at an economy of 7.6 in his last 10 T20 matches.
16 wkts, econ 8.59 in the last 10. Rated +3.4 runs a game with the ball.
Rated 3.4 runs better than an average bowler over four overs. He has 16 wickets at an economy of 8.59 in his last 10 T20 matches.
270 runs, SR 126, 9 sixes in the last 10. Rated +3.3 runs a game with the bat.
Rated 3.3 runs better than an average batter. He has 270 runs at a strike rate of 126.2 in his last 10 T20 matches.
13 wkts, econ 9.85 in the last 10. Rated −1.0 runs a game with the ball.
Rated 1 run worse than an average bowler over four overs. He has 13 wickets at an economy of 9.85 in his last 10 T20 matches.
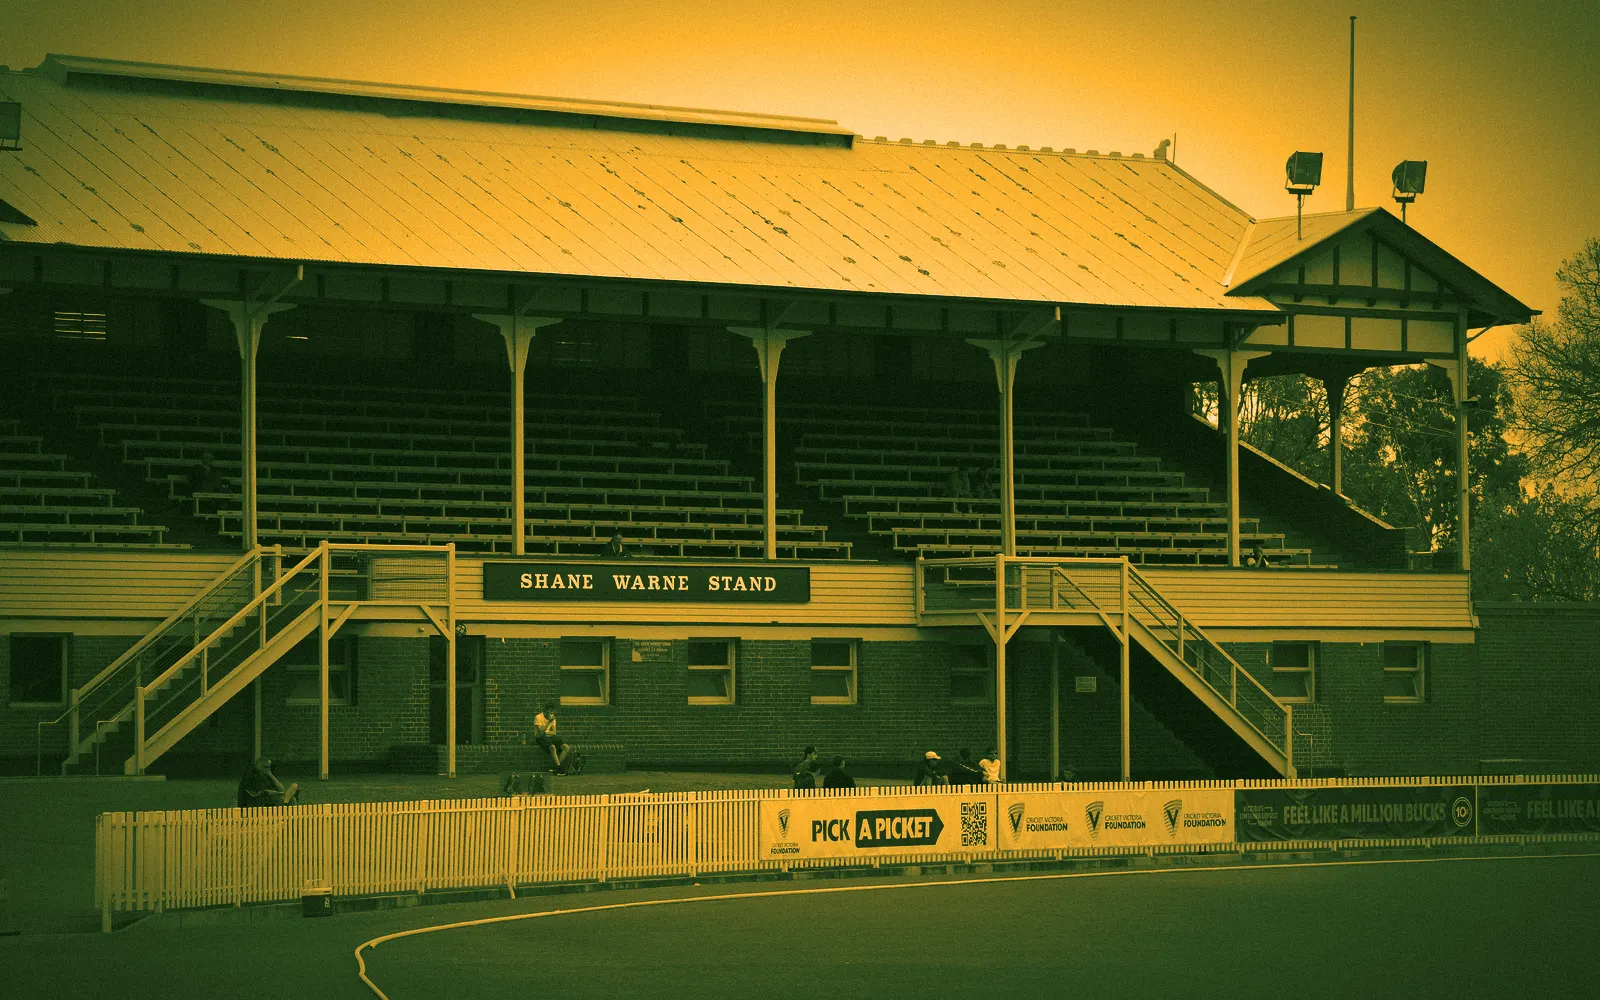
Melbourne, Australia · 2 BBL matches here
St Kilda's ground dates from 1856 and reopened in 2018 after a $40 million rebuild as Cricket Victoria's headquarters and Sheffield Shield home.
reached par (178). Median 205.
Recent BBL first innings average 170; games here have scored about 3% above their leagues' averages. Medians by era: 2008–2017 –, 2018–2022 205, 2023 onward –.
Too few completed first innings here to chart. Par comes from recent BBL scoring and the ground's record.
5 January 2026 at Junction Oval: 18 °C, humidity 61%, wind 15 km/h and 0 mm of rain during the hours of play. 36 of 430 evenings within three weeks of 21 December in the last 10 years had at least 1 mm of rain at Junction Oval during these hours.
These conditions are dry, like 5 January 2026 at Junction Oval: 18°C, 61% humidity, 15 km/h wind and no rain during play. Rain risk is low. At Australian BBL grounds, 4% of games in similar weather were shortened or washed out, 26 of 636. Rain should not be a factor. Heat and wind have made no measurable difference to first-innings scoring at Australian BBL grounds.
During play: 18.4 °C on average, humidity 61%, wind 16 km/h gusting to 45.
2 December 2023 at Junction Oval: 15 °C, humidity 92%, wind 18 km/h and 2.6 mm of rain during the hours of play. 36 of 430 evenings within three weeks of 21 December in the last 10 years had at least 1 mm of rain at Junction Oval during these hours.
These conditions are wet, like 2 December 2023 at Junction Oval, with 2.6 mm of rain during the hours of play. The wettest spell runs from 19:00 to 21:00 and overlaps the first innings. At Australian BBL grounds, 37% of games in similar weather were shortened or washed out. Heat and wind have made no measurable difference to first-innings scoring at Australian BBL grounds.
During play: 14.9 °C on average, humidity 92%, wind 18 km/h gusting to 40.
Heaviest rain 19:00–21:00, mostly over the first innings. Runs figures assume 20 overs. If overs are lost, totals and par come down: check how your bookmaker settles runs markets in reduced matches.
30 November 2017 at Junction Oval: 27 °C, humidity 57%, wind 13 km/h and 0 mm of rain during the hours of play. 36 of 430 evenings within three weeks of 21 December in the last 10 years had at least 1 mm of rain at Junction Oval during these hours.
This weather is hot and dry, with no rain expected during the match. At Australian BBL grounds, only 4% of games in similar weather were shortened or washed out. Rain should not be a factor, and heat and wind have made no measurable difference to first-innings scoring. The first innings is the only one that could overlap with any rain, but none is forecast.
During play: 26.8 °C on average, humidity 57%, wind 13 km/h gusting to 26.
| Batting position | Player and last 10 | Bat | Bowl |
|---|---|---|---|
| 1 | Tom Rogers186 runs, SR 122 | −1.5 | – |
| 2 | Sam Harperkeeper385 runs, SR 160 | +2.4 | – |
| 3 | Finn Allen171 runs, SR 154 | +6.7 | – |
| 4 | Campbell Kellaway1 over172 runs, SR 123; 0 wkts, econ 9.00 | −0.8 | −0.7 |
| 5 | Marcus Stoinis4 overs204 runs, SR 138; 16 wkts, econ 7.60 | +2.8 | +0.5 |
| 6 | Glenn Maxwell2 overs152 runs, SR 162; 3 wkts, econ 10.10 | +3.3 | −0.1 |
| 7 | Hilton Cartwright192 runs, SR 170 | +2.5 | – |
| 8 | Jamie Overton3 overs14 wkts, econ 8.89 | – | +0.4 |
| 9 | Mitch Swepson4 overs8 wkts, econ 7.07 | – | +0.7 |
| 10 | Todd Murphy2 overs8 wkts, econ 8.82 | – | +0.3 |
| 11 | Peter Siddle4 overs16 wkts, econ 8.59 | – | +3.4 |
| Batting position | Player and last 10 | Bat | Bowl |
|---|---|---|---|
| 1 | Jack Wildermuth3 overs222 runs, SR 159; 10 wkts, econ 9.92 | +0.5 | −2.0 |
| 2 | Nathan McSweeney210 runs, SR 146 | +0.1 | – |
| 3 | Tim Robinson178 runs, SR 131 | +0.7 | – |
| 4 | Matthew Renshaw2 overs270 runs, SR 126; 3 wkts, econ 7.00 | +3.3 | +0.1 |
| 5 | Max Bryant222 runs, SR 152 | +2.2 | – |
| 6 | Tom Curran3 overs12 wkts, econ 7.71 | +1.5 | +0.2 |
| 7 | Hugh Weibgen151 runs, SR 107 | −0.3 | – |
| 8 | Jimmy Peirsonkeeper, unsigned145 runs, SR 131 | +0.4 | – |
| 9 | Xavier Bartlett4 overs11 wkts, econ 7.82 | – | +0.7 |
| 10 | Michael Neser4 overs13 wkts, econ 9.85 | – | −1.0 |
| 11 | Matt Kuhnemann4 overs9 wkts, econ 7.29 | – | +0.8 |