Steve Smith
285 runs, SR 161, 17 sixes in the last 10. Rated +4.5 runs a game with the bat.
Rated 4.5 runs better than an average batter. He has 285 runs at a strike rate of 161 in his last 10 T20 matches, with 17 sixes.

Sixers 77%. Renegades 23%.
KFC BBL|16, match 9Tuesday 22 December 2026, 7:15pm AEDTSydney Cricket Ground, Sydney
Par is the total defended about half the time. The recent average covers 14 innings since Sept 2023.
7 of 14 won chasing over the last three years. All-time 54% (39 of 72). BBL and T20Is.
of games in dry weather at Australian BBL grounds were shortened (26 of 636).
The match is beyond the forecast range, so pick a past evening at the ground. The win chance and players stay the same.
of games in wet weather at Australian BBL grounds were shortened or washed out (37 of 101).
The match is beyond the forecast range, so pick a past evening at the ground. The win chance and players stay the same.
of games in dry weather at Australian BBL grounds were shortened (26 of 636).
The match is beyond the forecast range, so pick a past evening at the ground. The win chance and players stay the same.
Sydney Sixers are favoured, and the case is built on a paper strength gap of about 14 runs. They are rated 11.8 runs better than average with the bat and 2.2 better with the ball, a total of 14. Melbourne Renegades are rated 3.3 better with the bat but 3.8 worse with the ball, a total of -0.5. The Sixers lead the batting edge by 8.5 runs and the bowling edge by 5.9. Win chances are 77% to 23%.
The runs picture points to a par score of 179, with the Sixers projected at 185 batting first and the Renegades at 172. The recent league first-innings average is 170 from 60 innings, and the recent average here is 169 from 14 innings. Chasing has won 7 of the last 14 here, and the sharpest angle is the Renegades' bowling: rated 3.8 runs worse than average, with Will Sutherland rated 2.3 runs worse than an average bowler over four overs.
285 runs, SR 161, 17 sixes in the last 10. Rated +4.5 runs a game with the bat.
Rated 4.5 runs better than an average batter. He has 285 runs at a strike rate of 161 in his last 10 T20 matches, with 17 sixes.
17 wkts, econ 8.85 in the last 10. Rated +1.8 runs a game with the ball.
Rated 1.8 runs better than an average bowler over four overs. He has 17 wickets at an economy of 8.85 in his last 10 T20 matches.
7 wkts, econ 7.84 in the last 10. Rated −2.1 runs a game with the ball.
Rated 2.1 runs worse than an average bowler over four overs, on limited data. He has 7 wickets at an economy of 7.84 in his last 10 T20 matches.
311 runs, SR 150, 20 sixes in the last 10. Rated +2.8 runs a game with the bat.
Rated 2.8 runs better than an average opener. He has 311 runs at a strike rate of 150.2 in his last 10 T20 matches, with 20 sixes.
7 wkts, econ 9.15 in the last 10. Rated −2.3 runs a game with the ball.
Rated 2.3 runs worse than an average bowler over four overs. He has 7 wickets at an economy of 9.15 in his last 10 T20 matches.
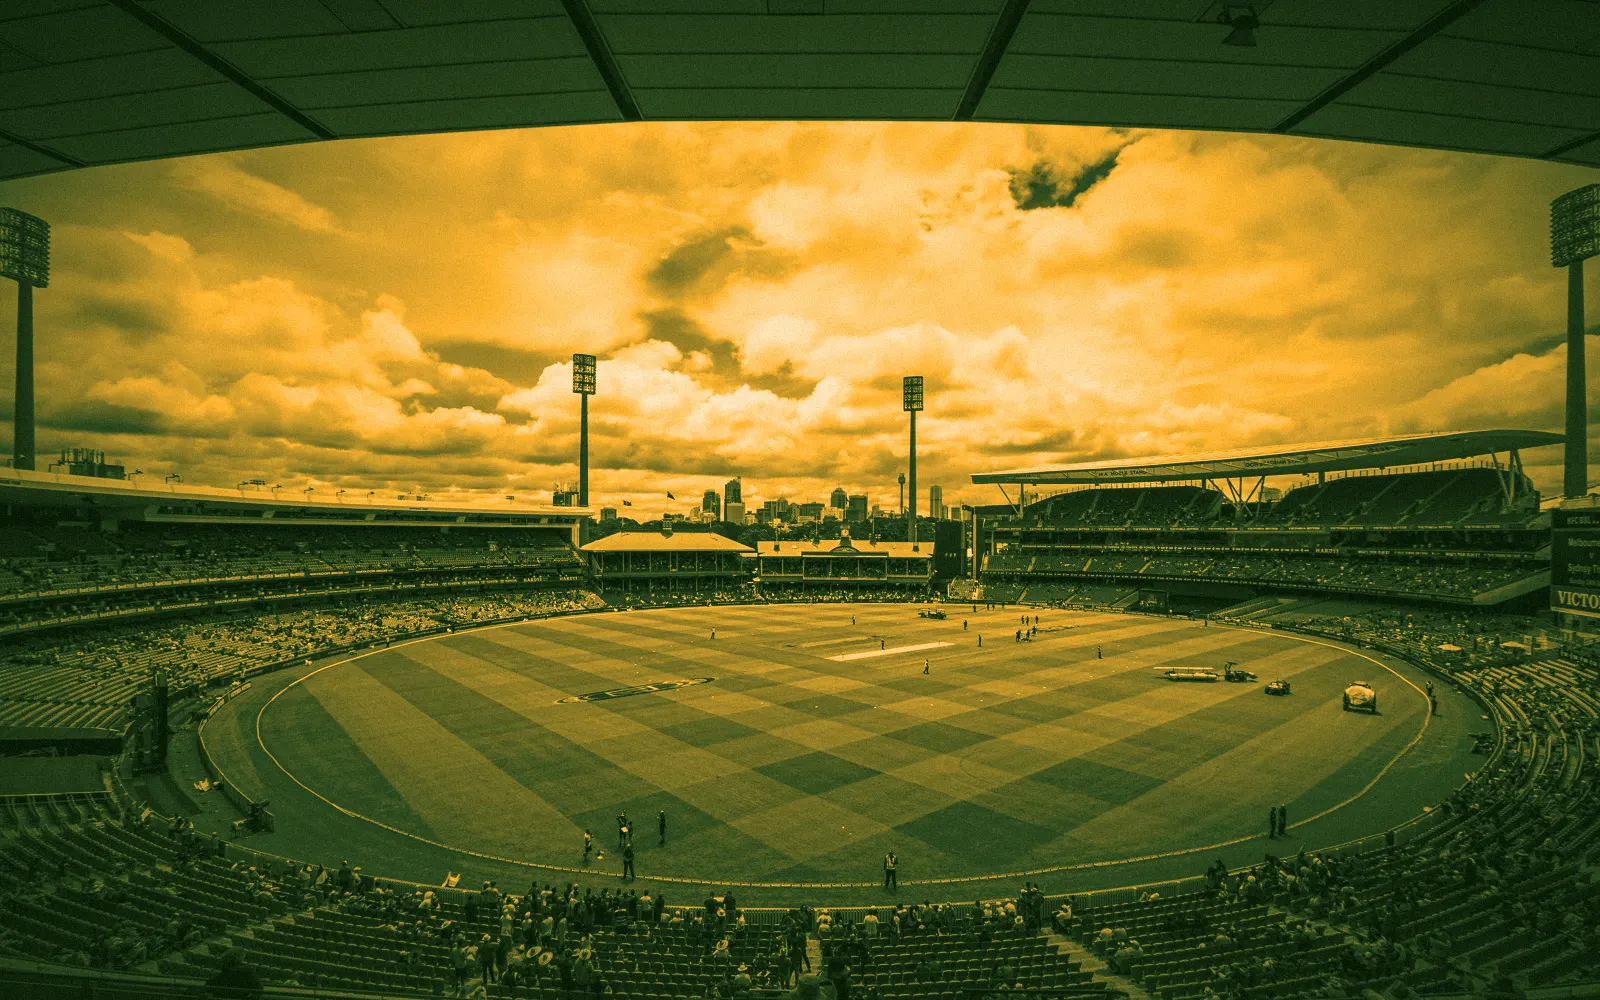
Sydney, Australia · 70 BBL matches here
Laid out as the Garrison Ground in 1854 and named the Sydney Cricket Ground in 1894, it held its first Test in February 1882.
reached par (179). Median 164.
Recent BBL first innings average 170; games here have scored about 3% above their leagues' averages. Medians by era: 2008–2017 158, 2018–2022 164, 2023 onward 157.
1 January 2023 at Sydney Cricket Ground: 22 °C, humidity 78%, wind 15 km/h and 0 mm of rain during the hours of play. 36 of 430 evenings within three weeks of 22 December in the last 10 years had at least 1 mm of rain at Sydney Cricket Ground during these hours.
These conditions are dry, with no rain expected during the match. At Australian BBL grounds, only 4% of games in similar weather were shortened or washed out. Rain should not be a factor, and heat and wind have made no measurable difference to first-innings scoring at Australian BBL grounds.
During play: 21.7 °C on average, humidity 78%, wind 15 km/h gusting to 38. Humidity climbs from 71% to 82%; at Australian BBL grounds, chasing success hasn't varied with humidity.
26 December 2020 at Sydney Cricket Ground: 20 °C, humidity 80%, wind 21 km/h and 1.8 mm of rain during the hours of play. 36 of 430 evenings within three weeks of 22 December in the last 10 years had at least 1 mm of rain at Sydney Cricket Ground during these hours.
These conditions are wet, with 1.8 mm of rain during the hours of play and a wettest spell from 20:00 to 22:00 that overlaps both innings. At Australian BBL grounds, 37% of games in similar weather were shortened or washed out. Rain risk is medium. Heat and wind have made no measurable difference to first-innings scoring at Australian BBL grounds. Runs lines assume 20 overs.
During play: 20.3 °C on average, humidity 80%, wind 21 km/h gusting to 48. Humidity climbs from 72% to 86%; at Australian BBL grounds, chasing success hasn't varied with humidity.
Heaviest rain 20:00–22:00, mostly over both innings. Runs figures assume 20 overs. If overs are lost, totals and par come down: check how your bookmaker settles runs markets in reduced matches.
1 January 2025 at Sydney Cricket Ground: 25 °C, humidity 69%, wind 17 km/h and 0 mm of rain during the hours of play. 36 of 430 evenings within three weeks of 22 December in the last 10 years had at least 1 mm of rain at Sydney Cricket Ground during these hours.
These conditions are dry, with no rain expected during play. At Australian BBL grounds, only 4% of games in similar weather were shortened or washed out. Rain should not be a factor, and heat and wind have made no measurable difference to first-innings scoring at Australian BBL grounds.
During play: 24.6 °C on average, humidity 69%, wind 17 km/h gusting to 48. Humidity climbs from 63% to 77%; at Australian BBL grounds, chasing success hasn't varied with humidity.
| Batting position | Player and last 10 | Bat | Bowl |
|---|---|---|---|
| 1 | Tim Seifert301 runs, SR 135 | +3.1 | – |
| 2 | Steve Smith285 runs, SR 161 | +4.5 | – |
| 3 | Josh Philippekeeper267 runs, SR 153 | +1.4 | – |
| 4 | Ollie Davies1 over174 runs, SR 112; 0 wkts, econ 12.00 | +0.4 | −0.5 |
| 5 | Jordan Silk193 runs, SR 118 | +0.7 | – |
| 6 | Jack Edwards4 overs41 runs, SR 95; 10 wkts, econ 9.49 | −0.3 | +0.6 |
| 7 | Lachlan Shaw188 runs, SR 146 | +0.6 | – |
| 8 | Joel Davies3 overs12 wkts, econ 6.77 | – | +1.2 |
| 9 | Ben Dwarshuis4 overs17 wkts, econ 8.85 | – | +1.8 |
| 10 | Fergus O'Neill4 overs7 wkts, econ 7.84 | – | −2.1 |
| 11 | Sean Abbott4 overs6 wkts, econ 8.95 | – | +1.1 |
| Batting position | Player and last 10 | Bat | Bowl |
|---|---|---|---|
| 1 | Josh Brown311 runs, SR 150 | +2.8 | – |
| 2 | Jake Fraser-McGurk163 runs, SR 138 | +2.1 | – |
| 3 | Caleb Jewell155 runs, SR 129 | −0.5 | – |
| 4 | Muhammad Rizwankeeper, unsigned204 runs, SR 117 | +0.3 | – |
| 5 | Ollie Peake188 runs, SR 134 | +0.5 | – |
| 6 | Will Sutherland4 overs120 runs, SR 120; 7 wkts, econ 9.15 | +1.5 | −2.3 |
| 7 | Sam Elliott3 overs23 runs, SR 72; 5 wkts, econ 7.96 | −1.7 | −0.6 |
| 8 | Tom Rogers4 overs9 wkts, econ 10.32 | – | −1.0 |
| 9 | Michael Archer2 overs0 wkts, econ 7.50 | – | −1.0 |
| 10 | Callum Stow3 overs6 wkts, econ 7.36 | – | +0.2 |
| 11 | Jason Behrendorff4 overs6 wkts, econ 9.19 | – | +0.9 |
.jpg)