Matt Short
452 runs, SR 145, 19 sixes in the last 10. Rated +4.2 runs a game with the bat.
Rated 4.2 runs better than an average opener. He has 452 runs at a strike rate of 144.9 in his last 10 T20 matches, with 19 sixes.

Strikers 60%. Thunder 40%.
KFC BBL|16, match 10Wednesday 23 December 2026, 6:45pm ACDT (7:15pm AEDT)Adelaide Oval, Adelaide
Par is the total defended about half the time. The recent average covers 15 innings since Sept 2023.
9 of 15 won chasing over the last three years. All-time 44% (40 of 91). BBL and T20Is.
of games in dry weather at Australian BBL grounds were shortened (26 of 636).
The match is beyond the forecast range, so pick a past evening at the ground. The win chance and players stay the same.
of games in wet weather at Australian BBL grounds were shortened or washed out (37 of 101).
The match is beyond the forecast range, so pick a past evening at the ground. The win chance and players stay the same.
of games in dry weather at Australian BBL grounds were shortened (26 of 636).
The match is beyond the forecast range, so pick a past evening at the ground. The win chance and players stay the same.
Adelaide Strikers are favoured, with a win chance of 60% against Sydney Thunder's 40%. They are also the stronger side on paper, about 6 runs clear, and the edge comes mostly from bowling: 4.3 runs better there and 1.9 runs better with the bat. The projected first-innings score is 176 for either side, against a par score of 180.
Adelaide's bowling strength is the sharpest angle. Hassan Ali is rated 3.2 runs better than an average bowler over four overs, with 24 wickets at an economy of 8.03 in his last 10 T20 matches. Sydney Thunder's bowling is rated 1.2 runs worse than average, and Nathan McAndrew is 1.8 runs worse than an average bowler. Chasers have won 9 of the last 15 games here, which gives the side batting second some encouragement.
452 runs, SR 145, 19 sixes in the last 10. Rated +4.2 runs a game with the bat.
Rated 4.2 runs better than an average opener. He has 452 runs at a strike rate of 144.9 in his last 10 T20 matches, with 19 sixes.
24 wkts, econ 8.03 in the last 10. Rated +3.2 runs a game with the ball.
Rated 3.2 runs better than an average bowler over four overs. He has 24 wickets at an economy of 8.03 in his last 10 T20 matches.
515 runs, SR 149, 15 sixes in the last 10. Rated +4.0 runs a game with the bat.
Rated 4 runs better than an average batter. He has 515 runs at a strike rate of 149.3 in his last 10 T20 matches, with 15 sixes.
6 wkts, econ 7.72 in the last 10. Rated +2.2 runs a game with the ball.
Rated 2.2 runs better than an average bowler and 1.7 runs better with the bat. He has 6 wickets at an economy of 7.72 in his last 10 T20 matches.
15 wkts, econ 10.63 in the last 10. Rated −1.8 runs a game with the ball.
Rated 1.8 runs worse than an average bowler over four overs. He has 15 wickets at an economy of 10.63 in his last 10 T20 matches.
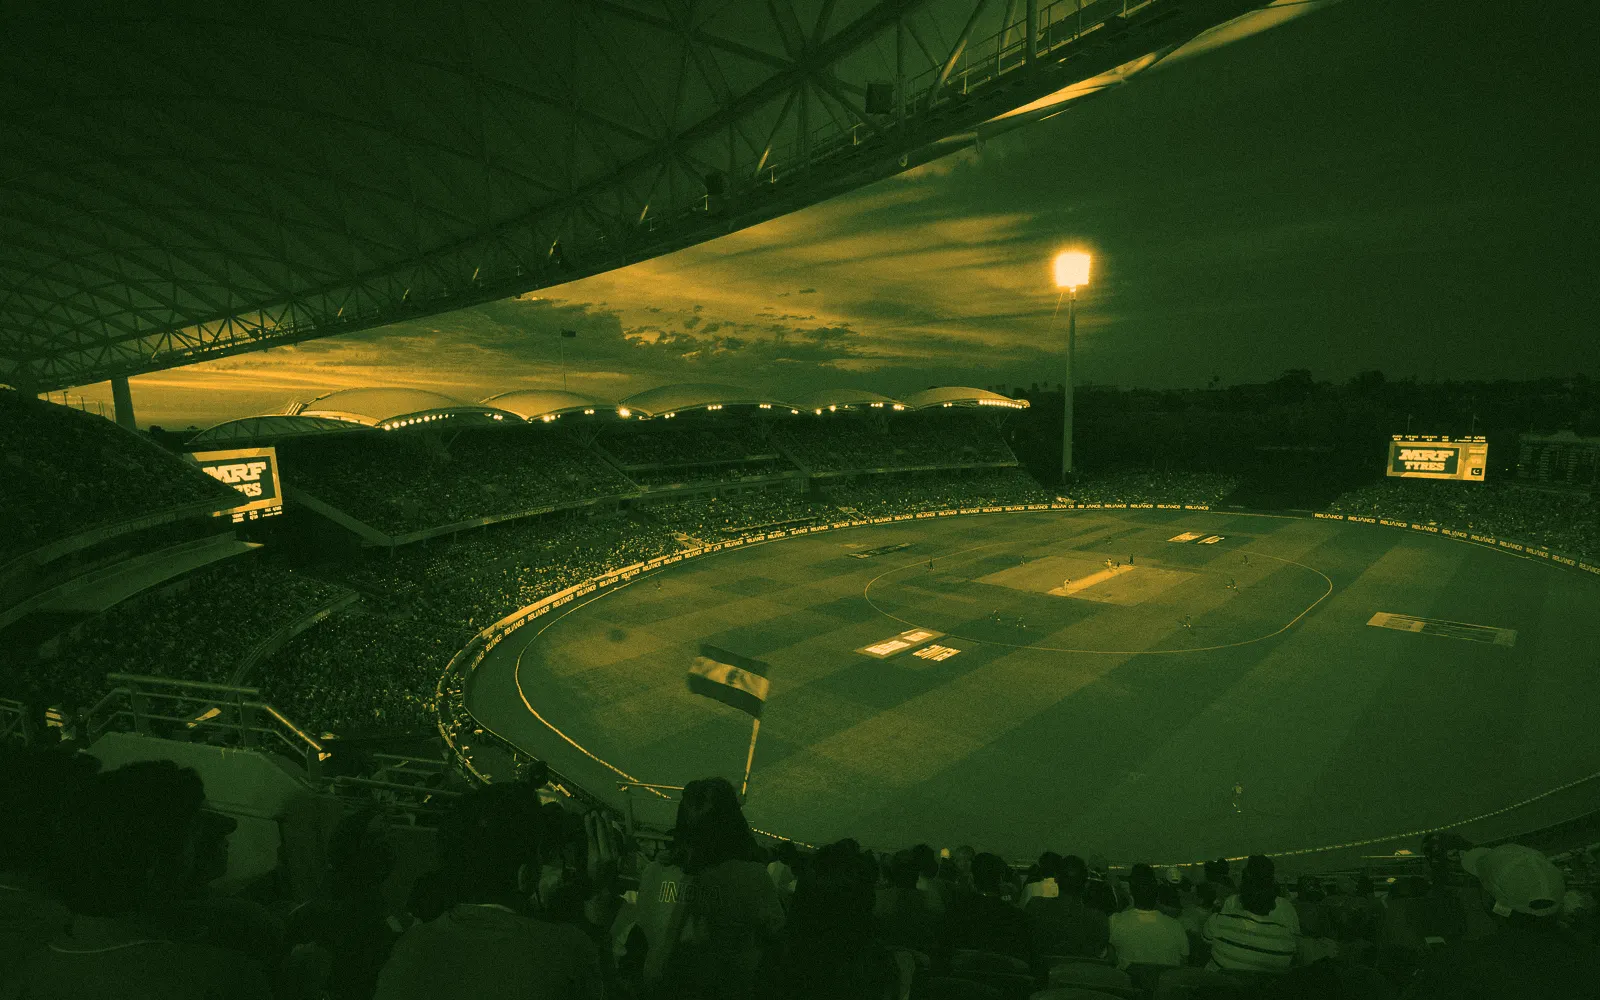
Adelaide, Australia · 83 BBL matches here
Cricket has been played on the oval since December 1873 and Tests since December 1884, and the hand-operated scoreboard of 1911 still works.
reached par (180). Median 167.
Recent BBL first innings average 170; games here have scored about 4% above their leagues' averages. Medians by era: 2008–2017 161, 2018–2022 170, 2023 onward 165.
10 December 2017 at Adelaide Oval: 21 °C, humidity 55%, wind 18 km/h and 0 mm of rain during the hours of play. 8 of 430 evenings within three weeks of 23 December in the last 10 years had at least 1 mm of rain at Adelaide Oval during these hours.
These conditions are dry, like 10 December 2017, with no rain expected during play. At Australian BBL grounds, only 4% of games in similar weather were shortened or washed out, so rain should not be a factor. Heat and wind have made no measurable difference to first-innings scoring. The projected totals of 176 for either side sit just below the par score of 180.
During play: 21.2 °C on average, humidity 55%, wind 18 km/h gusting to 36.
2 December 2024 at Adelaide Oval: 22 °C, humidity 87%, wind 7 km/h and 2.2 mm of rain during the hours of play. 8 of 430 evenings within three weeks of 23 December in the last 10 years had at least 1 mm of rain at Adelaide Oval during these hours.
This weather is wet, like 2 December 2024 at Adelaide Oval, with 2.2 mm of rain during the hours of play. The wettest spell runs from 18:30 to 19:30 and overlaps the first innings. At Australian BBL grounds, 37% of games in similar weather were shortened or washed out. Heat and wind have made no measurable difference to scoring. Lost overs and a rain-rule finish are a real possibility.
During play: 21.8 °C on average, humidity 87%, wind 7 km/h gusting to 29.
Heaviest rain 18:30–19:30, mostly over the first innings. Runs figures assume 20 overs. If overs are lost, totals and par come down: check how your bookmaker settles runs markets in reduced matches.
7 January 2023 at Adelaide Oval: 30 °C, humidity 25%, wind 11 km/h and 0 mm of rain during the hours of play. 8 of 430 evenings within three weeks of 23 December in the last 10 years had at least 1 mm of rain at Adelaide Oval during these hours.
These conditions are hot and dry, like 7 January 2023 at Adelaide Oval: 30 °C, 25% humidity, 11 km/h wind and no rain during play. Rain risk is low. At Australian BBL grounds, 4% of games in similar weather were shortened or washed out, 26 of 636. Rain should not be a factor, and heat and wind have made no measurable difference to first-innings scoring.
During play: 30.2 °C on average, humidity 25%, wind 11 km/h gusting to 32.
| Batting position | Player and last 10 | Bat | Bowl |
|---|---|---|---|
| 1 | Matt Short2 overs452 runs, SR 145; 14 wkts, econ 7.60 | +4.2 | +0.3 |
| 2 | Alex Careykeeper219 runs, SR 153 | +0.9 | – |
| 3 | Liam Scott232 runs, SR 123 | +1.6 | – |
| 4 | Jason Sangha187 runs, SR 121 | −0.9 | – |
| 5 | Mark Chapman289 runs, SR 149 | +3.0 | – |
| 6 | Ben Stokes2 overs156 runs, SR 108; 5 wkts, econ 7.96 (form 41 months old) | −0.1 | −0.9 |
| 7 | Jerrssis Wadia52 runs, SR 137 | −0.8 | – |
| 8 | Henry Thornton4 overs12 wkts, econ 8.68 | – | −0.3 |
| 9 | Hassan Aliunsigned, 4 overs24 wkts, econ 8.03 | – | +3.2 |
| 10 | Lloyd Pope4 overs14 wkts, econ 7.89 | – | −1.0 |
| 11 | Cameron Boyceunsigned, 4 overs8 wkts, econ 8.85 | – | +1.8 |
| Batting position | Player and last 10 | Bat | Bowl |
|---|---|---|---|
| 1 | Matt Gilkes232 runs, SR 156 | −0.3 | – |
| 2 | Sam Konstas160 runs, SR 106 | −2.4 | – |
| 3 | David Warner515 runs, SR 149 | +4.0 | – |
| 4 | Cameron Bancroft180 runs, SR 111 | −1.3 | – |
| 5 | Sam Billingskeeper273 runs, SR 155 | +1.9 | – |
| 6 | Daniel Sams4 overs50 runs, SR 106; 15 wkts, econ 7.38 | +0.9 | +1.1 |
| 7 | Chris Green3 overs142 runs, SR 150; 6 wkts, econ 7.72 | +1.7 | +2.2 |
| 8 | Nathan McAndrewunsigned, 4 overs15 wkts, econ 10.63 | – | −1.8 |
| 9 | Tanveer Sangha4 overs5 wkts, econ 8.61 | – | +2.0 |
| 10 | Ryan Hadley3 overs2 wkts, econ 12.79 | – | −3.6 |
| 11 | Aidan O'Connor2 overs1 wkts, econ 8.50 | – | −1.1 |
.jpg)