
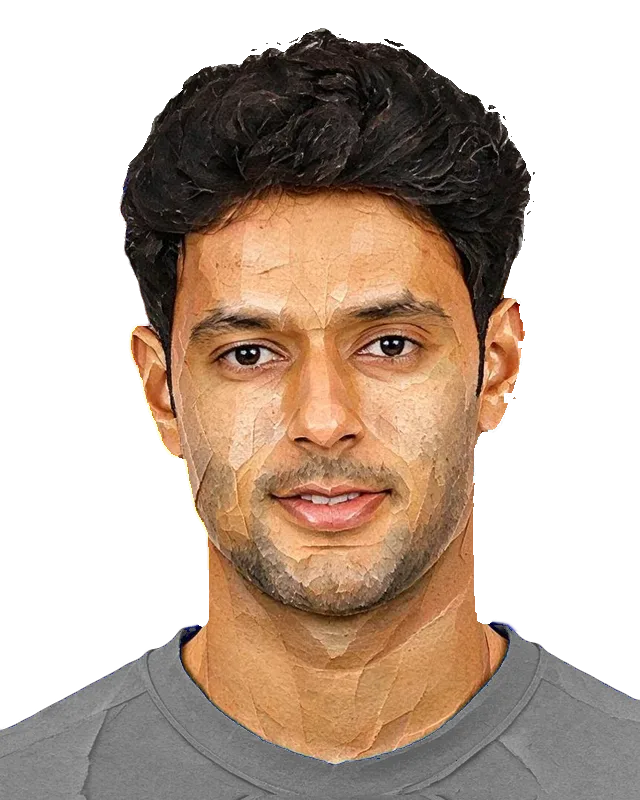
India · Mumbai · Chennai Super Kings · Arcs Andheri
Shivam Dube
33India
- Left-handed finisher
- Right-arm medium bowler
- Middle-overs bowler
Upcoming
T20 record
Batting
| Mat | Inns | Runs | Balls | Avg | SR | HS | 50s | 4s | 6s | Dot % | |
|---|---|---|---|---|---|---|---|---|---|---|---|
| T20 | 243 | 209 | 4,570 | 3,129 | 30.90 | 146.1 | 95 | 19 | 288 | 282 | 32.5 |
| SMAT | 57 | 52 | 1,048 | 743 | 32.80 | 141.0 | 71 | 2 | 68 | 58 | 31.2 |
| IPL | 92 | 87 | 2,129 | 1,464 | 31.30 | 145.4 | 95 | 10 | 132 | 137 | 34.4 |
| Last 10 | 10 | 7 | 71 | 58 | 14.20 | 122.4 | 27 | 0 | 7 | 3 | 43.1 |
Bowling
| Inns | Balls | Runs | Wkts | Econ | Avg | SR | Dot % | |
|---|---|---|---|---|---|---|---|---|
| T20 | 133 | 1,816 | 2,784 | 99 | 9.20 | 28.10 | 18.3 | 31.9 |
| SMAT | 49 | 794 | 1,115 | 37 | 8.43 | 30.10 | 21.5 | 32.5 |
| IPL | 19 | 154 | 277 | 6 | 10.79 | 46.20 | 25.7 | 21.4 |
| Last 10 | 7 | 82 | 164 | 6 | 12.00 | 27.30 | 13.7 | 25.6 |
Batting style
Balanced finisher
PowerplayOvers 1–6
Strike rate–Balls per dismissal–Middle oversOvers 7–15
Strike rate141Par 136Balls per dismissal32Par 21DeathOvers 16–20
Strike rate176Par 160Balls per dismissal16Par 12
| Figure | Player | Par | Against par |
|---|---|---|---|
| Average | 35.3 | 23.6 | |
| Strike rate | 152 | 144 | |
| Boundary % | 19.8 | 18.2 | |
| Dot % | 31.5 | 32.8 | |
| Sixes, % of boundaries | 49 | 41 | |
| Strike rate v pace | 152 | 151 | |
| Strike rate v spin | 156 | 134 | |
| Strike rate, first 10 balls | 135 | 119 |
1,573 balls in T20s · Oct 2023 – Oct 2026
Compare with other playersBowling style
Expensive medium-pacer
PowerplayOvers 1–6
Economy7.19Par 8.59Middle oversOvers 7–15
Economy9.20Par 7.97DeathOvers 16–20
Economy11.97Par 9.55
| Figure | Player | Par | Against par |
|---|---|---|---|
| Economy | 9.65 | 8.43 | |
| Dot % | 31.3 | 34.9 | |
| Boundary % | 20.8 | 16.6 | |
| Balls per wicket | 15.9 | 17.3 | |
| Average | 25.6 | 24.3 | |
| Economy v right-handers | 10.01 | 8.35 | |
| Economy v left-handers | 9.62 | 8.72 |
859 balls bowled in T20s · Jan 2024 – Oct 2026
Compare with other playersStrengths and weaknesses
Strengths
- Runs per dismissal30.9 (field 22.6 across IPL, Syed Mushtaq Ali Trophy and 2 more)
- Six-hittingone every 11.1 balls (field 15.2 across IPL, Syed Mushtaq Ali Trophy and 2 more)
- Death (overs 16–20), battingSR 172 (field 155 across IPL, Syed Mushtaq Ali Trophy and 2 more)
Weaknesses
- Death (overs 16–20), bowling11.18 an over (field 9.36 across Syed Mushtaq Ali Trophy, T20Is and 2 more)
- Middle overs, bowling8.83 an over (field 7.64 across Syed Mushtaq Ali Trophy, T20Is and 2 more)
- Economy9.20 an over (field 8.04 across Syed Mushtaq Ali Trophy, T20Is and 2 more)
By phase
| Balls faced | SR | Out | Balls bowled | Econ | Wkts | |
|---|---|---|---|---|---|---|
| Powerplay | 97 | 81.4 | 2 | 216 | 7.44 | 10 |
| Middle overs | 1,961 | 135.2 | 68 | 1,189 | 8.83 | 54 |
| Death (overs 16–20) | 1,071 | 171.7 | 78 | 411 | 11.18 | 35 |
Men's T20
- Runs a match
- +1.8
- batting, above an average player
Men's T20 batting, runs a match
AveragePeak +2.9
April 2024Now +1.820172019202120232025- ICC rank
- 36
- 570 points
- Runs a match
- −3.3
- bowling, above an average player
Men's T20 bowling, runs a match
Peak −2.0
November 2019Now −3.320172019202120232025- ICC rank
- –
| Last 2 years | Mat | Runs | Avg | SR | Wkts | Bowl avg | Econ |
|---|---|---|---|---|---|---|---|
| T20 | 94 | 1,640 | 31.5 | 153.6 | 48 | 25.5 | 9.70 |
Teams
- IndiaInternationalLast T20I Oct 2026
- MumbaiSyed Mushtaq Ali Trophy4 appearances in the club's latest season
- Chennai Super KingsIndian Premier League13 appearances in the club's latest season
- Arcs AndheriMumbai T20 LeagueLast played Jun 2026
Leagues
| Years | Mat | Runs | Avg | SR | Wkts | Econ | |
|---|---|---|---|---|---|---|---|
| IPL | 2019–2026 | 92 | 2,129 | 31.30 | 145.4 | 6 | 10.79 |
| SMAT | 2016–2025 | 57 | 1,048 | 32.80 | 141.0 | 37 | 8.43 |
| Mumbai T20 League | 2019–2026 | 13 | 215 | 35.80 | 158.1 | 16 | 8.58 |
T20 streaks
| Last 10 | Career | Now | Best | ||
|---|---|---|---|---|---|
| 30+ score | 0/10 | 26% | 0 | 4 | 52221461403277 |
| Took a wicket | 5/10 | 50% | 0 | 9 | 2002110020 |
- Shivam Dube has made 30 or more in 0 of the last 10 T20 innings.
- Shivam Dube has taken a wicket in 5 of the last 10 T20s bowled in.
Last 10 T20s
| Date | Team | Opponent | Ground | Bat | Bowl | Result |
|---|---|---|---|---|---|---|
| 17 Oct 2026 | India | West Indies | M Chinnaswamy Stadium | – | – | No result |
| 9 Oct 2026 | India | West Indies | JSCA International Stadium Complex | 7 (10) | 0/30 (2.0) | West Indies won by 6 wickets |
| 6 Oct 2026 | India | West Indies | Bharat Ratna Shri Atal Bihari Vajpayee Ekana Cricket Stadium | – | – | India won by 8 wickets |
| 3 Oct 2026 | India | Pakistan | Korogi Sports Park | 27 (15) | 2/33 (3.0) | India won by 19 runs |
| 1 Oct 2026 | India | Sri Lanka | Korogi Sports Park | 3 (9) | – | India won by 124 runs |
| 22 Sept 2026 | India | Japan | Sano International Cricket Ground | 0* (1) | – | India won by 2 runs |
| 17 Sept 2026 | India | Afghanistan | Arun Jaitley Stadium | 14 (10) | – | India won by 127 runs |
| 15 Sept 2026 | India | Afghanistan | Arun Jaitley Stadium | – | 0/13 (1.0) | India won by 7 wickets |
| 13 Sept 2026 | India | Afghanistan | Arun Jaitley Stadium | – | 0/21 (1.0) | India won by 7 wickets |
| 25 Jul 2026 | India | Zimbabwe | Harare Sports Club | 6* (3) | 1/13 (1.4) | India won by 90 runs |
Pace and pitch map
125130135Usual paceQuicker balls
202420252026
T20s709 balls
FullOff sideLeg sideShort
Read more
- Impact Player: the death of the all-rounder?Washington Sundar played 17 IPL games this season and bowled nine overs. Four seasons into the Impact Player rule, the IPL's top order bowls half as much as it did, and the rest of T20 cricket shows no such change.
- How much credit has Shivam Dube's batting actually earned?His last two years beat the standard for top-seven batters by a distance, yet one part of his record still holds him back.