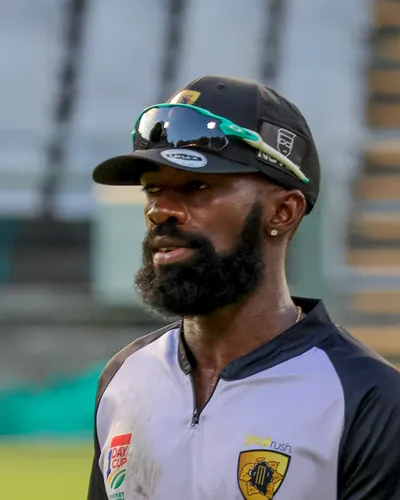
Jhedli van Briesies
54 runs, SR 93 in the last 6. Rated −3.8 runs a game with the bat.
Rated 3.8 runs worse than an average batter on limited data, with 54 runs at a strike rate of 93 in his last six T20 matches.

Boland 137-9; our pre-match call 19%. Titans 137-8; our pre-match call 81%.
Pro20 Cup 2026/27, match 53
Tied
Sunday 25 October 2026, 1:00pm SASTBoland Park, Paarl
| Measure | Boland | Titans |
|---|---|---|
| XI caps | 209T20s between the XI | 830T20s between the XI |
| Top-seven average | 22.6T20 batting | 30.5T20 batting |
Titans are favoured, with an 81% win chance, and are stronger on paper by about 28 runs at Boland Park. That edge is all batting: their batting is rated 29.7 runs above Boland's and outweighs a bowling unit rated 2.2 runs worse. The projected first-innings totals point the same way: Titans 185, Boland 169, against a par score of 162.
Titans' top seven average 23.5 against left-arm pace since 2023, 21% below their 29.9 against all bowling, where the benchmark rises 1%; Boland's Akhona Mnyaka, in our predicted XI, is their left-arm pace option.
54 runs, SR 93 in the last 6. Rated −3.8 runs a game with the bat.
Rated 3.8 runs worse than an average batter on limited data, with 54 runs at a strike rate of 93 in his last six T20 matches.
8 wkts, econ 9.47 in the last 10. Rated −3.0 runs a game with the ball.
Rated 3.0 runs worse than an average bowler over his expected overs on limited data, with 8 wickets at 9.47 an over in his last 10 T20 matches.

418 runs, SR 188, 37 sixes in the last 10. Rated +6.0 runs a game with the bat.
Rated 6.0 runs better than an average batter, with 418 runs at a strike rate of 188 in his last 10 T20 matches, including 37 sixes.

624 runs, SR 187, 32 sixes in the last 10. Rated +4.9 runs a game with the bat.
Rated 4.9 runs better than an average opener, with 624 runs at a strike rate of 187 in his last 10 T20 matches, including 32 sixes.
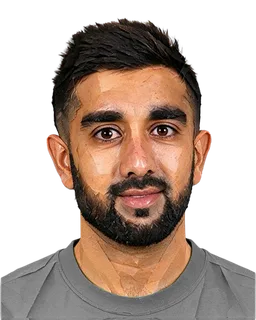
15 wkts, econ 6.76 in the last 10. Rated +2.8 runs a game with the ball.
Rated 2.8 runs better than an average bowler over four overs, with 15 wickets at 6.76 an over in his last 10 T20 matches.