
Oddsworth

New Zealand v India, 1st ODI: Too close to call

New Zealand 49%. India 51%.

New Zealand v India ODI series 2026, 1st ODI

Wednesday 4 November 2026, 3:00pm NZDT (day/night)Eden Park, Auckland

Prediction locks 4th November, 01:30 UTCWhen we've said 50–55%, the favourite won 50 of 94

The sides

MeasureNew ZealandIndia
Rating17901st of 2017652nd of 20
Home advantage+130Rating points–Touring
XI caps650ODIs between the XI1,081ODIs between the XI
Top-seven average39.3ODI batting in New Zealand45.1ODI batting in New Zealand
Bowling average33.7Five main bowlers, ODIs35.7Five main bowlers, ODIs

When New Zealand bat

+0.44 an over
PowerplayOvers 1–10−0.19MiddleOvers 11–45+0.65DeathOvers 46–50+0.23

When India bat

+0.50 an over
PowerplayOvers 1–10+0.80MiddleOvers 11–45+0.47DeathOvers 46–50+0.13

First innings

288New Zealand bat first
258India bat first
280Par
286Average here since 2019, 4 innings
336Highest here, Australia 2007

Too close to call: India's batting against New Zealand's attack

Too close to call at Eden Park, with New Zealand at 49 per cent and India 51. India's XI is rated 46.5 runs a match above an average Full Member side, New Zealand's 32.9, and the gap sits in the batting: India 54.4, New Zealand 30.2. New Zealand's bowlers are the better group, rated 2.8 against India's -8, and they are at home, where the first innings has averaged 286 since 2019 and three of four completed matches went to the side batting first.

New Zealand's top seven average 67.1 against left-arm pace since 2023, 55 per cent above their 43.4 against all bowling, where Full Member top sevens average 8 per cent less against it. India's left-arm pace is Arshdeep Singh, in our predicted XI, with 30 wickets at 22.2 apiece.

What total is safe?

ODIs in New Zealand since 2019

First inningsDefended
Under 2500%0 of 13
250–27983%5 of 6
280–30940%2 of 5
310–339100%5 of 5
340+75%3 of 4

The case for New Zealand

  • New Zealand's XI rates 32.9 runs a match above an average Full Member side, and its bowling half is the stronger of the two at 2.8 against India's -8.
  • Three of the four completed ODIs at Eden Park since 2019 went to the side batting first, where the first innings has averaged 286.
  • Daryl Mitchell has 770 runs in his past 10 innings and Mark Chapman 464 at a strike rate of 105.1, with Mitchell Santner taking 12 wickets in his past 10 matches.

Batting standout

Daryl Mitchell

Daryl Mitchell

770 runs in the last 10 ODIs. Career average 57.4, strike rate 95.

Bowling standout

Kyle Jamieson

Kyle Jamieson

16 wickets in the last 10 ODIs. Career economy 5.31.
The case for India

  • India's XI rates 46.5 runs a match above an average Full Member side, built on a batting rating of 54.4 against New Zealand's 30.2.
  • India's top seven average 56.5 against all bowling since 2023 at a strike rate of 104.6; Shubman Gill has 783 runs in his past 10 innings, Rohit Sharma 554 and Virat Kohli 617.
  • Kuldeep Yadav took 19 wickets in his past 10 matches and has 201 in ODIs; Arshdeep Singh has 30 ODI wickets at 22.2 apiece.

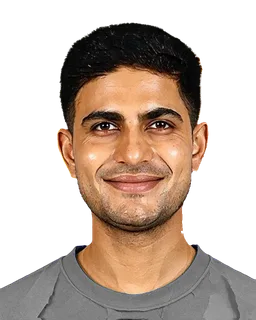
Batting standout

Shubman Gill

Shubman Gill

783 runs in the last 10 ODIs. Career average 64.0, strike rate 103.
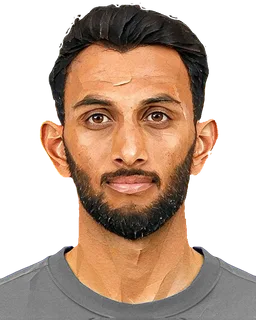
Bowling standout

Share