
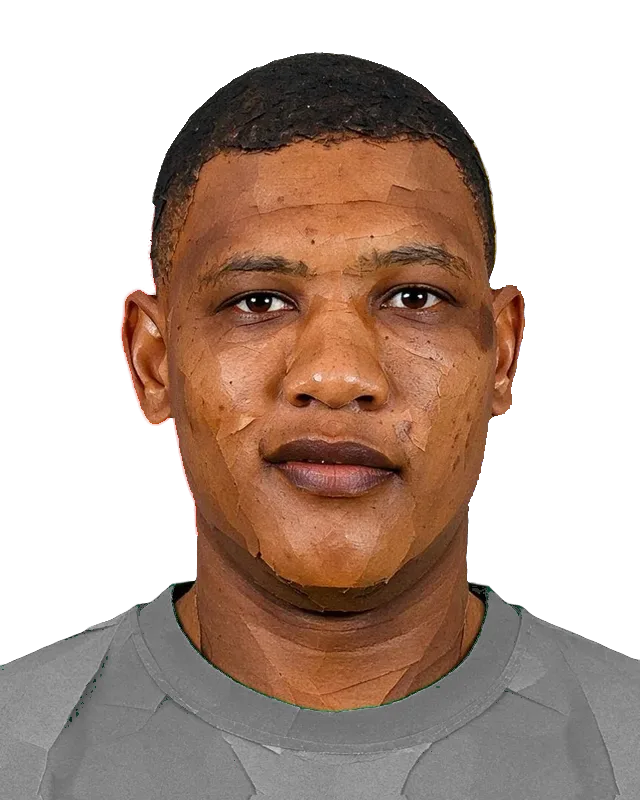
South Africa · Dolphins · Paarl Royals · Seattle Orcas
Ottniel Baartman
33South Africa
- Right-handed lower-order batter
- Right-arm medium-fast bowler
- Death bowler
Upcoming
T20 record
Bowling
| Inns | Balls | Runs | Wkts | Econ | Avg | SR | Dot % | |
|---|---|---|---|---|---|---|---|---|
| T20 | 94 | 1,972 | 2,551 | 145 | 7.76 | 17.60 | 13.6 | 43.0 |
| Pro20 | 29 | 623 | 728 | 33 | 7.01 | 22.10 | 18.9 | 41.4 |
| SA20 | 33 | 666 | 924 | 61 | 8.32 | 15.10 | 10.9 | 41.4 |
| MLC | 11 | 246 | 308 | 22 | 7.51 | 14.00 | 11.2 | 45.9 |
| Last 10 | 10 | 222 | 231 | 18 | 6.24 | 12.80 | 12.3 | 50.5 |
Batting
| Mat | Inns | Runs | Balls | Avg | SR | HS | 50s | 4s | 6s | Dot % | |
|---|---|---|---|---|---|---|---|---|---|---|---|
| T20 | 95 | 19 | 30 | 65 | 3.00 | 46.2 | 12 | 0 | 2 | 0 | 64.6 |
| Pro20 | 29 | 3 | 0 | 3 | 0.00 | 0.0 | 0 | 0 | 0 | 0 | 100.0 |
| SA20 | 34 | 6 | 14 | 21 | 4.70 | 66.7 | 6 | 0 | 1 | 0 | 52.4 |
| MLC | 11 | 4 | 2 | 6 | 1.00 | 33.3 | 1 | 0 | 0 | 0 | 66.7 |
| Last 10 | 10 | 4 | 2 | 6 | 1.00 | 33.3 | 1 | 0 | 0 | 0 | 66.7 |
Bowling style
Dominant death seamer
PowerplayOvers 1–6
Economy7.36Par 8.11Middle oversOvers 7–15
Economy7.40Par 7.89DeathOvers 16–20
Economy8.70Par 9.69
| Figure | Player | Par | Against par |
|---|---|---|---|
| Economy | 7.84 | 8.59 | |
| Dot % | 43.9 | 38.4 | |
| Boundary % | 17.5 | 18.3 | |
| Balls per wicket | 12.9 | 17.1 | |
| Average | 16.8 | 24.4 | |
| Economy v right-handers | 7.78 | 8.58 | |
| Economy v left-handers | 7.93 | 8.61 |
1,391 balls bowled in T20s · Jan 2024 – Nov 2026
Compare with other playersStrengths and weaknesses
Strengths
- Wicket-takingone every 13.6 balls (field 17.1 across SA20, CSA T20 Challenge and 2 more)
- Dot balls bowled43% (field 38% across SA20, CSA T20 Challenge and 2 more)
By phase
| Balls faced | SR | Out | Balls bowled | Econ | Wkts | |
|---|---|---|---|---|---|---|
| Powerplay | 0 | – | 0 | 678 | 7.10 | 38 |
| Middle overs | 15 | 20.0 | 0 | 597 | 7.31 | 42 |
| Death (overs 16–20) | 50 | 54.0 | 10 | 697 | 8.80 | 65 |
Men's T20
- Runs a match
- +3.3
- above an average player
Men's T20 bowling, runs a match
AverageNow +3.3 above2020202220242026- ICC rank
- 67
- 496 points
| Last 2 years | Mat | Wkts | Bowl avg | Econ | Runs | Avg | SR |
|---|---|---|---|---|---|---|---|
| T20 | 42 | 69 | 16.7 | 8.17 | 28 | 4.0 | 50.9 |
Teams
Leagues
| Years | Mat | Wkts | Econ | Runs | Avg | SR | |
|---|---|---|---|---|---|---|---|
| SA20 | 2023–2026 | 34 | 61 | 8.32 | 14 | 4.70 | 66.7 |
| Pro20 | 2019–2026 | 29 | 33 | 7.01 | 0 | 0.00 | 0.0 |
| MLC | 2024–2026 | 11 | 22 | 7.51 | 2 | 1.00 | 33.3 |
T20 streaks
| Last 10 | Career | Now | Best | ||
|---|---|---|---|---|---|
| Took a wicket | 9/10 | 80% | 0 | 17 | 3111232410 |
- Ottniel Baartman has taken a wicket in 9 of the last 10 T20s bowled in.
Last 10 T20s
| Date | Team | Opponent | Ground | Bat | Bowl | Result |
|---|---|---|---|---|---|---|
| 6 Nov 2026 | Dolphins | Easterns | Willowmoore Park | – | 0/23 (4.0) | Lost by 8 runs (DLS)L 8 runs (DLS) |
| 1 Nov 2026 | Dolphins | Boland | Kingsmead | – | 1/22 (4.0) | Lost by 7 wicketsL 7 wkts |
| 23 Oct 2026 | Dolphins | South Western Districts | Kingsmead | – | 4/12 (3.0) | Won by 10 wickets (DLS)W 10 wkts (DLS) |
| 10 Jul 2026 | Seattle Orcas | MI New York | Grand Prairie Stadium | – | 2/18 (4.0) | Lost by 17 runsL 17 runs |
| 5 Jul 2026 | Seattle Orcas | Texas Super Kings | Knight Riders Cricket Ground | 0 (1) | 3/9 (4.0) | Won by 9 runsW 9 runs |
| 2 Jul 2026 | Seattle Orcas | MI New York | Knight Riders Cricket Ground | 1* (1) | 2/23 (4.0) | Lost by 5 runsL 5 runs |
| 28 Jun 2026 | Seattle Orcas | Los Angeles Knight Riders | Oakland Coliseum | – | 1/38 (4.0) | Won by 20 runsW 20 runs |
| 26 Jun 2026 | Seattle Orcas | San Francisco Unicorns | Oakland Coliseum | 0 (2) | 1/39 (4.0) | Lost by 2 wicketsL 2 wkts |
| 25 Jun 2026 | Seattle Orcas | Washington Freedom | Oakland Coliseum | – | 1/11 (2.0) | Won by 88 runsW 88 runs |
| 21 Jun 2026 | Seattle Orcas | Los Angeles Knight Riders | Grand Prairie Stadium | 1* (2) | 3/36 (4.0) | Lost by 81 runsL 81 runs |
Pace and pitch map
135140145Usual paceQuicker balls
2023202420252026
T20s1,393 balls
FullOff sideLeg sideShort