
MI Cape Town · Manchester Super Giants · Nottinghamshire · Gulf Giants
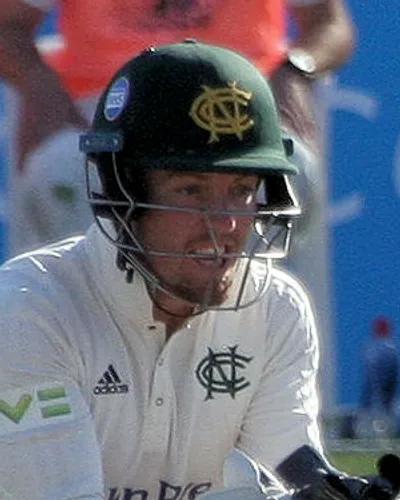
Tom Moores
30United Kingdom
- Left-handed watchful middle-order batter
- Batting rating
- +1.4
- runs versus average over 4 overs
- T20 matches
- 174
- since Jun 2016
Men's T20
- Runs a match
- +1.1
- above an average player
| Last 2 years | Mat | Runs | Avg | SR | Wkts | Bowl avg | Econ |
|---|---|---|---|---|---|---|---|
| T20 | 41 | 981 | 30.7 | 146.0 | – | – | – |
Teams
- MI Cape TownSA20|5Bats at 5 · Wicketkeeper-batter · Keeper · 2 appearances in the club's latest season
- Manchester Super GiantsThe HundredLast played Aug 2026
- NottinghamshireT20 BlastLast played Jul 2026
- Gulf GiantsILT20Last played Dec 2025
Leagues
| Years | Mat | Runs | Avg | SR | Wkts | Econ | |
|---|---|---|---|---|---|---|---|
| T20 Blast | 2016–2026 | 144 | 2,842 | 27.9 | 140.3 | – | – |
| LPL | 2020–2021 | 8 | 96 | 13.7 | 112.9 | – | – |
| Nepal Premier League | 2024 | 7 | 165 | 23.6 | 126.9 | – | – |
| BPL | 2023–2024 | 6 | 67 | 16.8 | 103.1 | – | – |
| ILT20 | 2025 | 4 | 24 | 24.0 | 141.2 | – | – |
| PSL | 2019 | 3 | 10 | 5.0 | 47.6 | – | – |
| SA20 | 2026 | 2 | 9 | 4.5 | 60.0 | – | – |
Batting style
Watchful middle-order batter
| Player | Par | Below parAbove par | |
|---|---|---|---|
| Strike rate | 137 | 134 | |
| Boundary % | 17.6 | 15.6 | |
| Dot % | 37.1 | 31.9 | |
| Sixes, % of boundaries | 39 | 37 | |
| Strike rate v pace | 144 | 143 | |
| Strike rate v spin | 130 | 127 | |
| Strike rate, first 10 balls | 114 | 113 | |
| Balls per dismissal | 20 | 17 |
860 balls · Feb 2024 – Jul 2026
Middle-order batter
| Player | Par | Below parAbove par | |
|---|---|---|---|
| Average | 48.1 | 32.9 | |
| Strike rate | 125 | 91 | |
| Boundary % | 18.8 | 10.1 | |
| Dot % | 45.3 | 48.4 | |
| Average v pace | 44.4 | 31.9 | |
| Average v spin | 54.3 | 34.7 | |
| Strike rate v pace | 117 | 92 | |
| Strike rate v spin | 137 | 91 |
309 balls · Jul 2024 – Aug 2025
Balanced middle-order batter
| Player | Par | Below parAbove par | |
|---|---|---|---|
| Average | 23.3 | 30.7 | |
| Average v pace | 21.4 | 29.4 | |
| Average v spin | 45.3 | 38.1 | |
| Balls per dismissal | 44 | 57 | |
| Dot % | 75.5 | 73.7 | |
| Boundary % | 7.6 | 7.3 |
1,595 balls · Sept 2021 – Jun 2024
Batting
| Mat | Inns | Runs | Balls | Avg | SR | HS | 50s | 4s | 6s | Dot % | |
|---|---|---|---|---|---|---|---|---|---|---|---|
| T20 | 174 | 160 | 3,213 | 2,359 | 25.7 | 136.2 | 80 | 14 | 262 | 148 | 35.9 |
| SA20 | 2 | 2 | 9 | 15 | 4.5 | 60.0 | 9 | 0 | 1 | 0 | 66.7 |
| Last 10 | 10 | 10 | 215 | 159 | 23.9 | 135.2 | 51 | 1 | 19 | 10 | 35.8 |
By phase
| Balls faced | SR | Out | Balls bowled | Econ | Wkts | |
|---|---|---|---|---|---|---|
| Powerplay | 333 | 104.8 | 18 | 0 | – | 0 |
| Middle overs | 1,489 | 133.5 | 64 | 0 | – | 0 |
| Death (overs 16–20) | 537 | 163.1 | 43 | 0 | – | 0 |
Strengths and weaknesses
Strengths
- Six-hittingone every 15.9 balls (field 18.9 across T20 Blast, Nepal Premier League and 5 more)
Weaknesses
- Powerplay, battingSR 105 (field 133 across T20 Blast, LPL and 3 more)
- Dot balls36% (field 32% across T20 Blast, Nepal Premier League and 5 more)